RoomChecker Website Reports
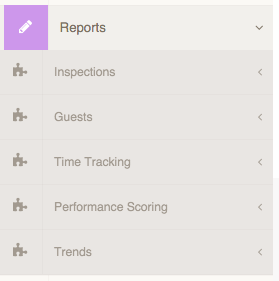
On the RoomChecker website, users can view reports showing information, such as number of issues per month, issues reported by guests, and current issues. All reports are available through the site menu on the left.
Viewing Reports

The types of reports that the user can view are in tables or graphs depending on the type of data. The user may be asked to define some details such as the location and date on which to report, or some reports can also be by monthly date range.
Printing Reports
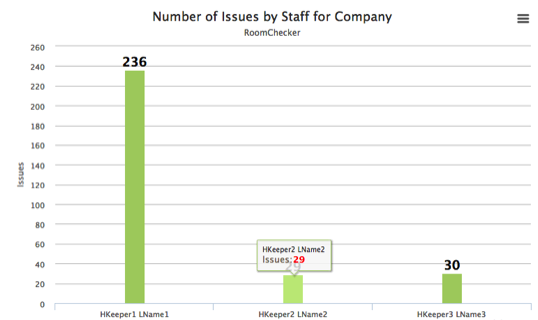
Some Charts can be printed or downloaded in different formats. If there is a menu button in the upper right it can be clicked to provide options to print or download the information.
Data in Tables
Data in tables can be searched using the field in the upper right. Data can also be sorted by clicking the column header. If there are multiple pages of data you can view additional pages by clicking Next at the bottom of the table or choosing the number of rows to display on the table.

Data in Graphs
Data in graphs can be narrowed by date range and location. Data in graphs can also be printed or downloaded using the menu button in the upper right of the graph. If you need more information about the data displayed you can move your mouse over the column in question for a definition and number of issues. If you click on the column you hovered over you will be taken to a page showing the details of the data making up the graph.


